Dataset
We are deeply grateful for the generous sponsorship that has made the data generation for this hackathon possible.

Accessing the dataset
The datasets can be downloaded from Zenodo.
The following files are in the Zenodo repository:
- The raw celllranger output (filename: raw_cellranger_output.zip)
- The pre-processed data (filename: preprocessed_data.zip).
- Within the zip file, there are h5ad, SingleCellExperiment, and Seurat object of the pre-processed data.
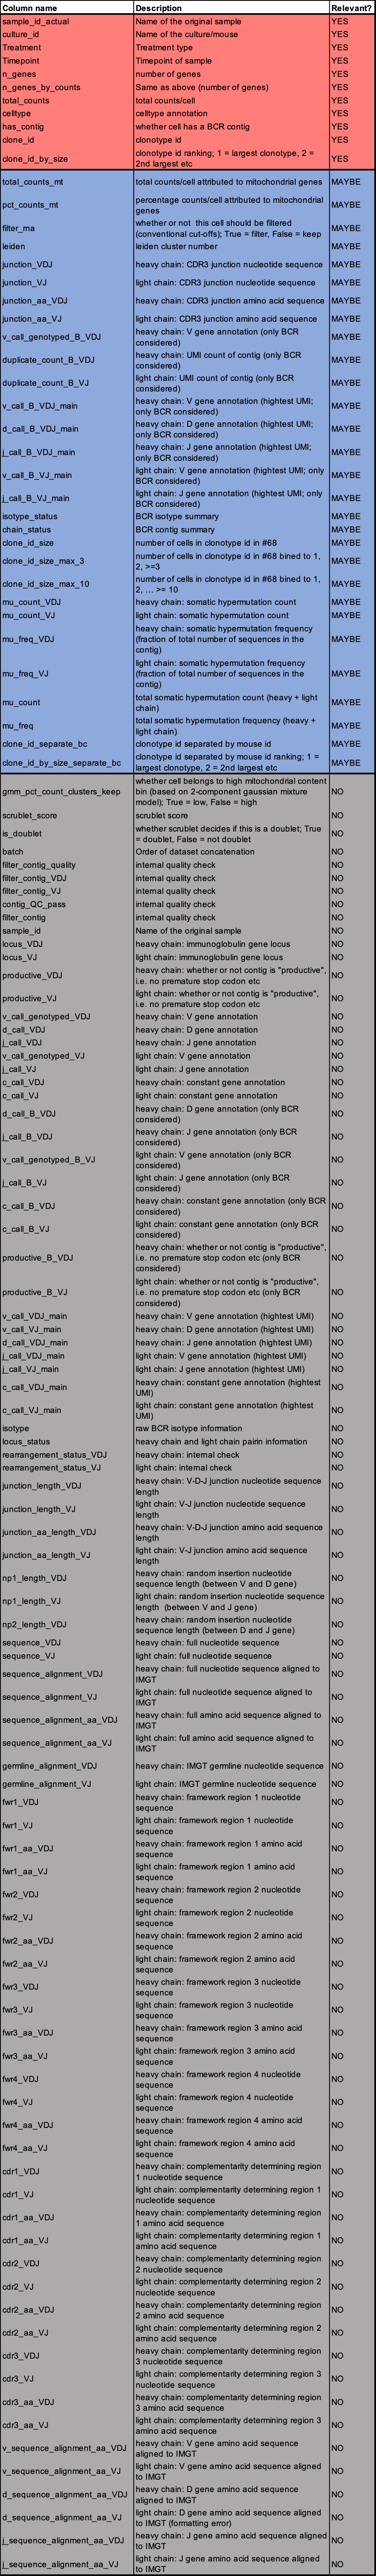
- Explanation for the fields used to store the metadata of the cells (for the pre-processed data) is available at the end of this page.
- The samples have all been concatenated into one single object.
The scripts used to pre-process the data is available on GitHub.
The processed BCR data in AIRR formats are on GitHub.
Background information about the dataset
Biological summary and experimental background behind the dataset.
The immune response and B cell biology
The immune system is our body’s defence against infection. A particularly important cell type in our immune system are B cells that make antibodies to recognise and fight foreign bacteria or viruses. After encountering these foreign invaders, B cells are activated and can then clonally expand. They can either differentiate immediately into short-lived plasma cells, or undergo a process call the germinal centre (GC) reaction. Within the GC, with the help from antigen-specific T cells, B cells can undergo further cycles of clonal expansion and selection before differentiating into antibody-secreting plasma cells or memory B cells, which are capable of being reactivated upon antigen re-exposure. Understanding why and how different B cell clones make different cell fate decisions during this process is a longstanding area of interest in the field.
Immunoglobulin genes can act as endogenous barcodes in B cells
All B cells express the immunoglobulin (Ig) genes that encode antibody proteins (also known as B cell receptor) and these Ig genes can act as endogenous barcodes for clonal identity. There are three Ig loci and typically, each B cell will express IgH and either IgL or IgK. During development in the bone marrow, the Ig loci must be recombined from many different Variable (V), Diversity (D) or Joining (J) genes encoded in the DNA, retaining only one of each gene (V, D and J for IgH; V and J for IgK/IgK). For example, the human Ig heavy chain region contains 44 V gene segments, 27 D gene segments and 6 J gene segments that are randomly recombined. During this process, additional insertions and deletions can occur between the VDJ genes, further increasing the complexity of the recombined Ig locus. The estimated potential number of recombinant products is 1011 and this is important for the ability of the immune system to recognise an enormous diversity of foreign pathogens.
While this is a complicated biological process, for the purposes of this Hackathon, we will treat the VDJ gene sequence as an endogenous barcode that allows us to compare clonally-related and -unrelated cells with one another.
The issue of sampling: how many clones is enough?
One major challenge with comparing clonally-related cells identified through any method relates to whether one can sample enough members for different clones to accurately reflect the entire clonal population. For example, if an expanded clone (or clonotype) consists of 100 clonally-related cells, but we only examine 5 of them, are we accurately assessing the properties of that clone? This is especially a challenge in the immune system, where many single-cell datasets examining B cell clonality are derived from peripheral blood or tissues, and out of the billions of B cells in the body, we can only sample several thousand. This means the majority of “expanded clones” identified in existing datasets contain only 2-4 members, limiting the biological questions we can ask about properties of different clones. It also is a barrier to the development of new tools in this area.
The datasets
For this Hackathon, we have performed an experiment to try and overcome the above biological and technical challenge. Using mouse B cells as a model, and their endogenous VDJ barcodes as a method to identify clonally related cells, we expanded a small number (5,000) of mouse B cells in cell culture and then performed single-cell RNA and VDJ sequencing after several days of expansion.
Two different datasets were generated to answer different biological and technical questions, CpG dataset and CD40 dataset. There are two time-points for the CD40 dataset and one time-point for the CpG dataset. There are two replicates for each dataset (2 replicates for CpG, 2 replicates for each of the two time-points in the CD40 dataset). The datasets are sequenced across 2 different batches.
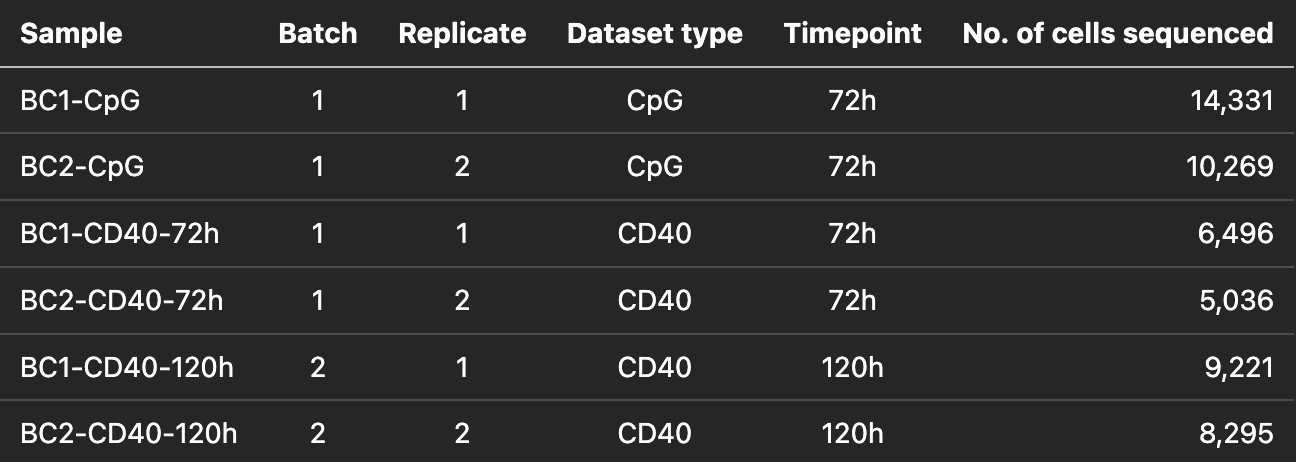
CpG dataset - Comparison of clonally-expanded cells with other expanded clones
In this experiment, we aimed to capture B cells that have expanded, but not undergone differentiation.
Mouse naïve B cells (5,000 cells) were stimulated in cell culture with CpG for 72 hours in 2 biological replicates. CpG activates B cells to proliferate through TLR signalling but does not result in differentiation of the B cells (Turner et al., Journal of Immunology, 2008). At 72 hours, the cells had expanded by 7.8-fold and 10,000 cells per replicate were loaded onto the 10X Genomics platform.
Based on previous experiments with this system, clonally-related cells are significantly more likely to divide (proliferate) at the same rate and for a similar number of divisions (approximately 1-5 divisions), than cells that are not clonally related to one another. This new dataset will allow us to explore this and quantify if there are unique transcriptional signatures between different expanded clones that may explain this.
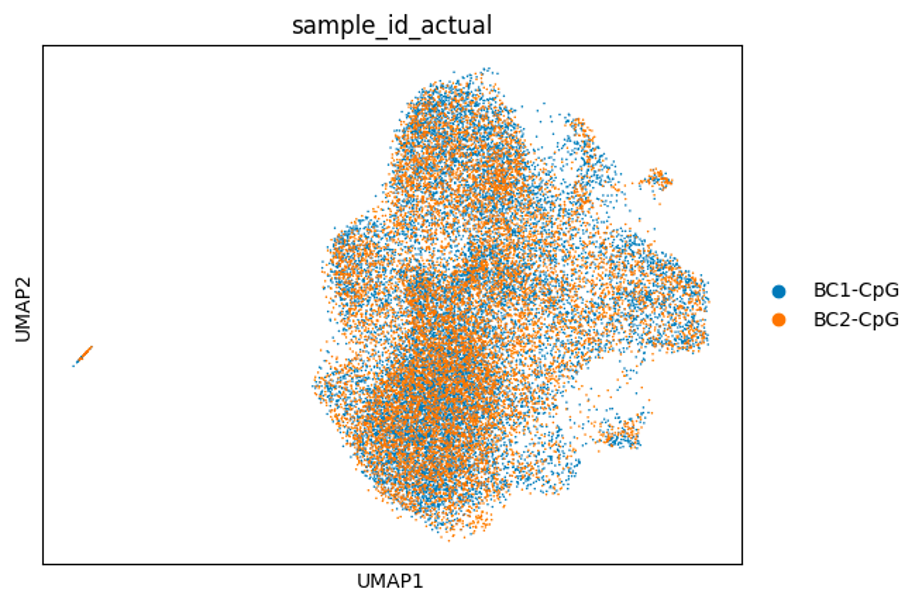
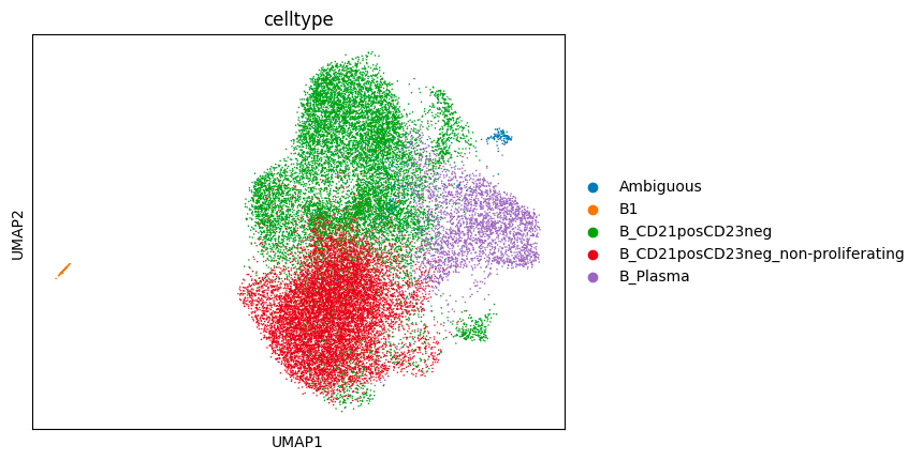
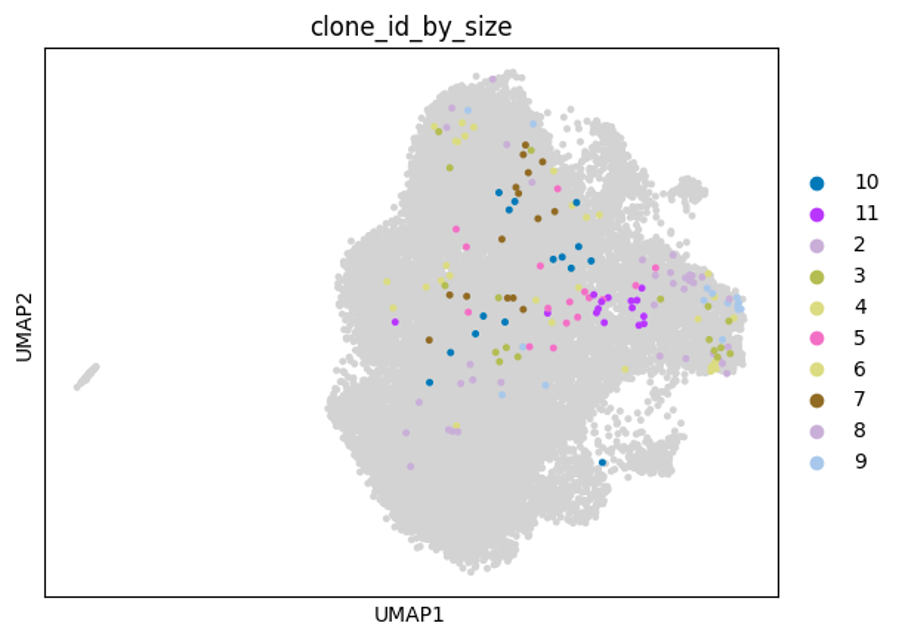
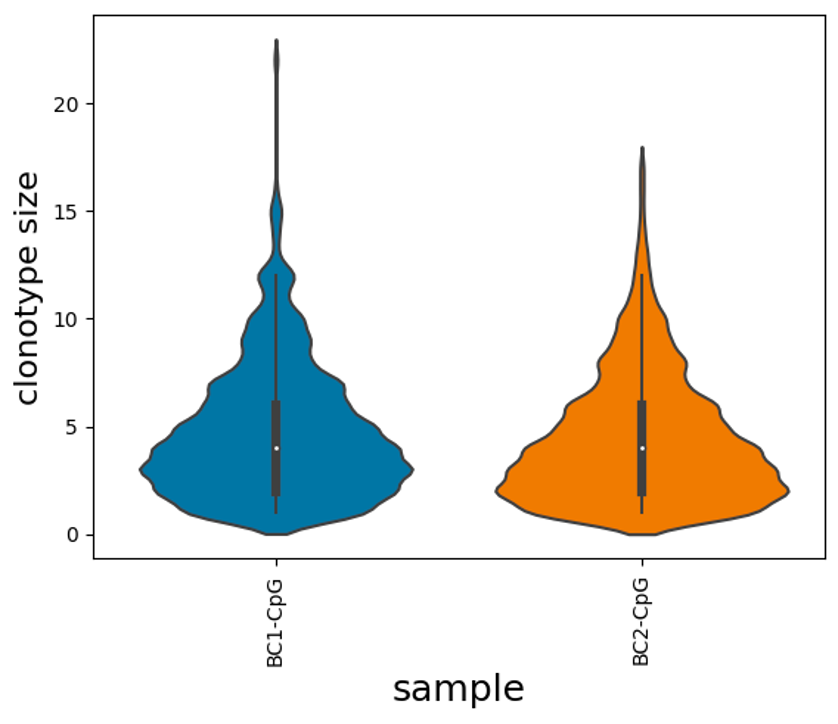
Below are some UMAP plots of the data (steps taken to produce them are described in the next section). Each dot is a cell.
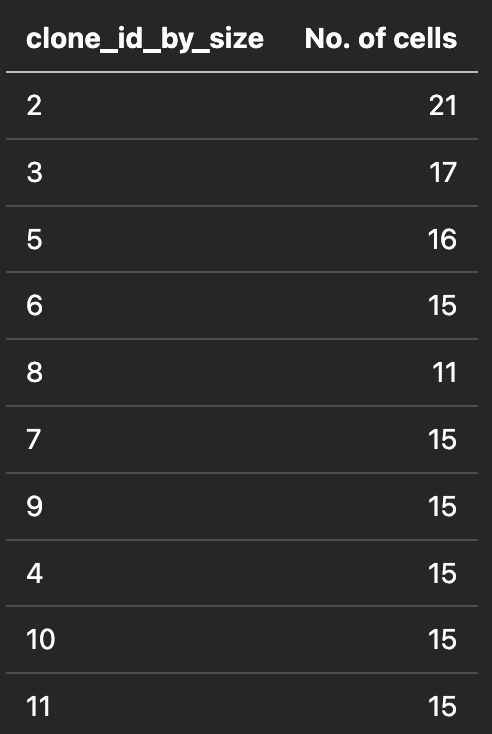
The table below shows the number of cells for a given clonotype:
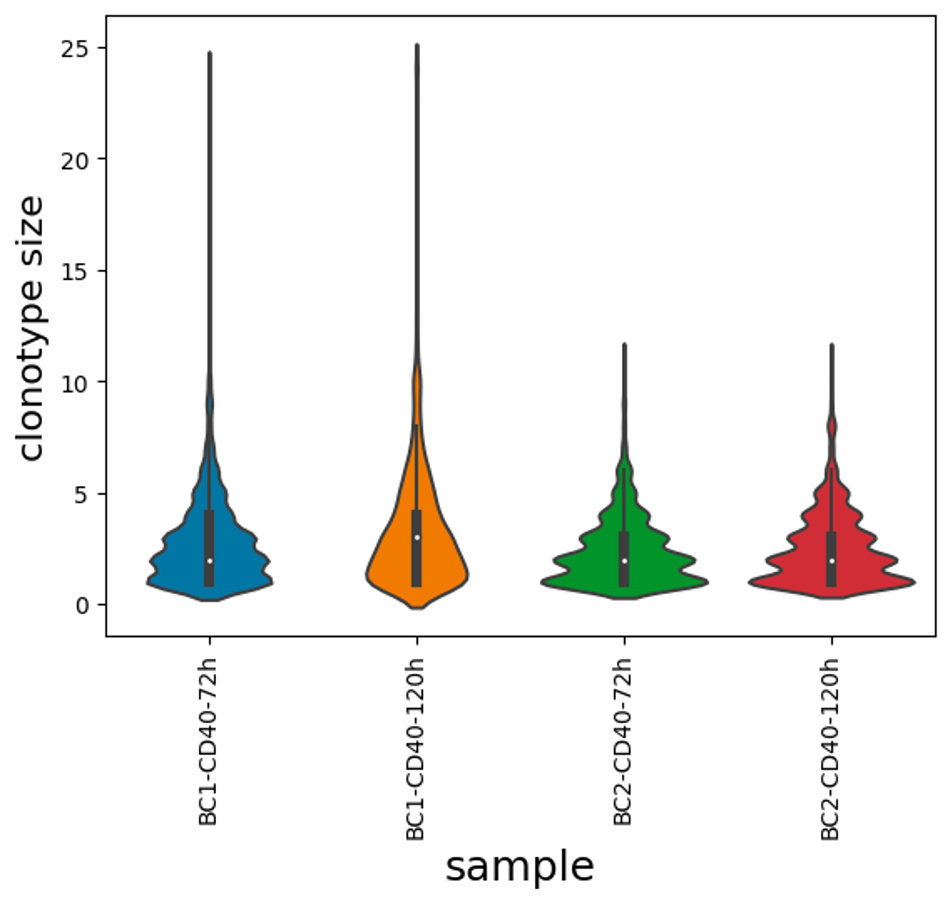
CD40 dataset - Tracking expanded clones through differentiation (two timepoints)
In this experiment we aimed to capture expanded B cell clones across two different time points (72h and 120h) to track and compare their gene expression. Mouse naïve B cells (5,000 cells) were stimulated in cell culture with anti-CD40, IL-4 and IL-5. These cytokines mimic T cell help, and induce the naive B cells to clonally expand and differentiate into plasma cells (Hasbold et al., Nature Immunology, 2004). At 72 hours, the cells had expanded 6.48-fold to approximately 32,000 cells, and we collected 5,000 of these per replicate and load them onto the 10X Genomics platform. We then continued to grow the remaining cells for another two days (31.2-fold expansion), before loading a further 5000 cells per replicate onto the 10X platform.
From this experiment, we expect to observe some cells acquiring expression of plasma cell marker genes (e.g., Prdm1, Irf4, Xbp1, Sdc1, Tnfrsf17), which are very well defined (Shi et al., Nature Immunology, 2015). Previous studies have reported that clonally-related cells are more likely to acquire the same fate (Duffy, Science, 2012) - the goal is to use this dataset to test this hypothesis.
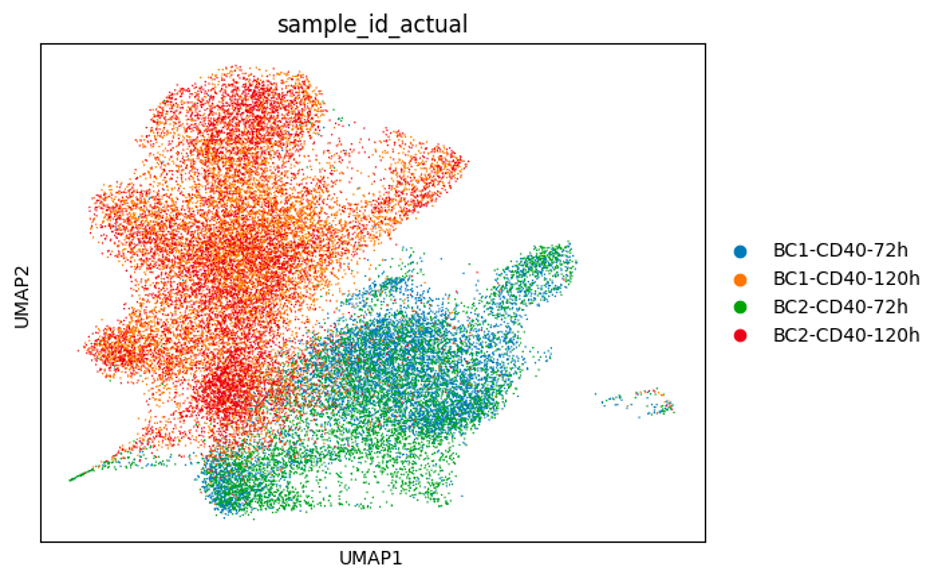
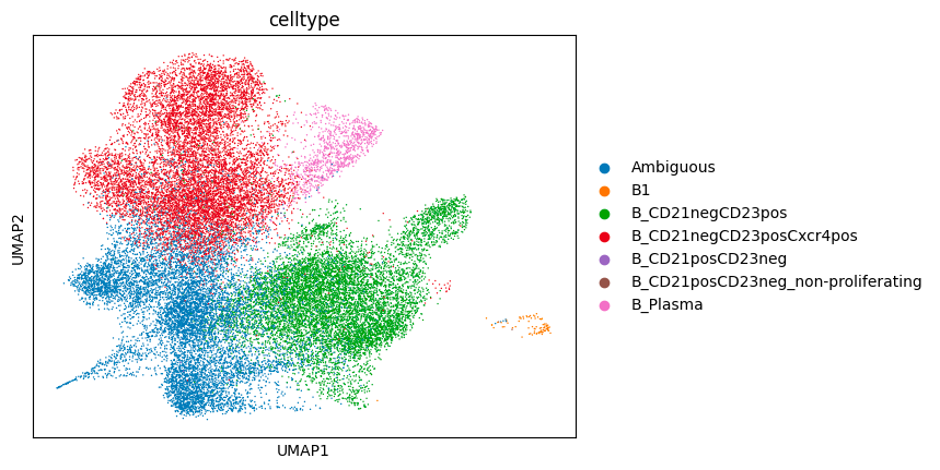
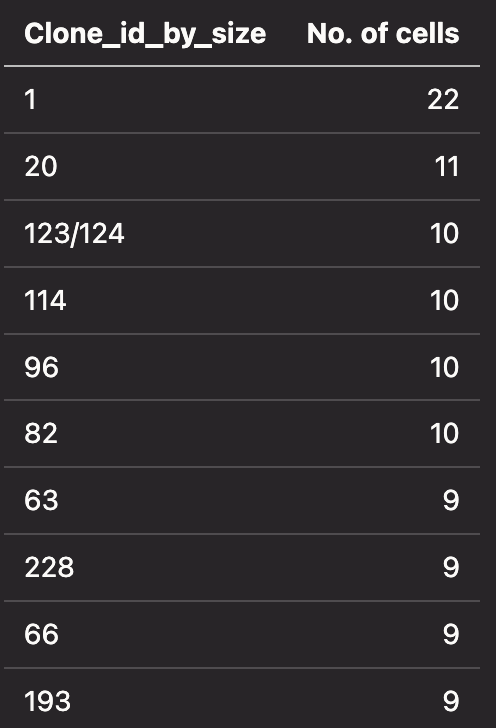
Below are some UMAP plots of the data (steps taken to produce them are described in the next section). Each dot is a cell.
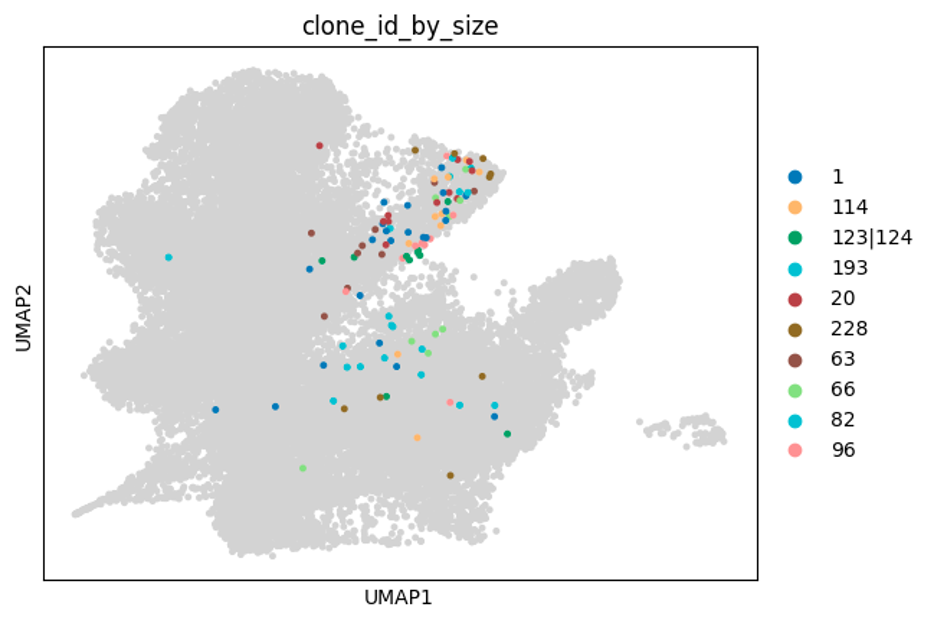
The table below shows the number of cells for a given clonotype:
Data pre-processing
Reads were aligned to the mm10 mouse reference using CellRanger software. Gene expression quantification was also performed using CellRanger.
Gene counts have been normalised to counts per ten thousand (CPT) and log-transformed. Standard quality control (QC) steps, typically applied in scRNAseq data analysis, have intentionally been omitted. Additionally, no data integration/batch correction was performed. There are in total 53,648 cells and 32,285 genes.
VDJ analysis and clonotype identification was performed with Dandelion (Suo et al., Nature Biotechnology, 2023). Clonotype ids are stored in the clone_id column (the global clonotype id) or clone_id_separate_bc (clonotype id within each biological replicate). Detailed information on the clonotype identification criteria using hamming distance can be found here.
The clone_id_by_size column (you can interpret this as ranking of ‘clone_id’ size), as well as the clone_id_by_size_separate_bc column, is an alternative clonotype id where the number indicates the relative size of the clonotype. For example, a clonotype id of 1 in the clone_id_by_size column indicates that the cell belongs to the largest clonotype globally, while a clonotype id of 1 in the clone_id_by_size_separate_bc column indicates that the cell belongs to the largest clonotype within the biological replicate. Note! This is not to be confused with the clone_id_size columns! These columns indicate the actual size (number of cells) of the clonotypes.
All other columns from the V(D)J analysis will typically have a _VDJ or _VJ suffix – this indicates that the information contained in that column is either relevant to the BCR heavy chain (_VDJ) or light chain (_VJ) for that cell. For instance, the v_call_genotyped_B_VDJ column contains the V genes for the BCR heavy chains in each cell whereas the v_call_genotyped_B_VJ column contains the V genes for the BCR light chains in each cell. For understanding the prefixes, please refer to the AIRR rearrangement schema.
All the data pre-processing scripts post CellRanger are available here.
Pre-processed data metadata fields
Extra information
In all of the V(D)J columns, if there is a \ or a | in the annotation, it usually means that there is potentially more than 1 possible pair of BCRs - this can happen in some context e.g. naive B cells are known to express both IgM and IgD BCRs. In this dataset, some of these arise due to multiple heavy/light chains appearing in the same cell. For instance, in the clone_id of 123|124 above, all the cells in this clonotype have 1 heavy chain (IGH) and 2 light chains (IGK). If we look at one cell e.g. BC1-CD40-120h_CATCGAAAGTTAGGTA-1, we can look at the BCR information:
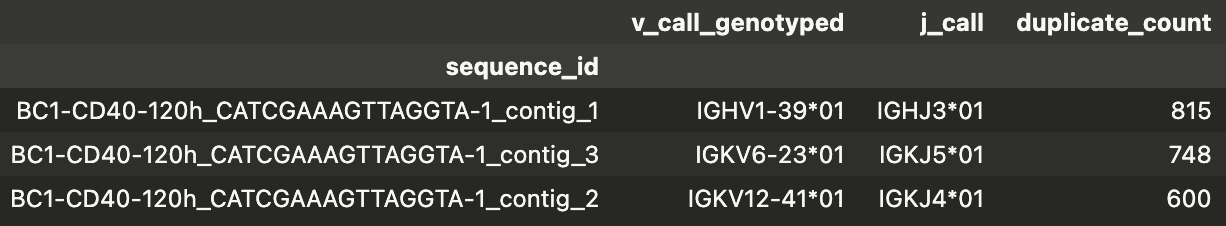
You can see that the UMI counts for all the contigs are very high and it’s hard to tell whether they are all real or one of the pair is an artifact? Dual light chains have also been reported. In any case, Dandelion would elect to keep these contigs and one future improvement to this aspect could be to only consider the highest expressing contig as the main BCR.
Acknowledgement
Experiments were designed by Hamish King, Miles Horton and Shalin Naik.
Experiments were performed by Miles Horton and Esther Bandala Sanchez with the generous support of
Data processing and preparation by Zewen Kelvin Tuong, Givanna Putri, and Peter Hickey.